How Canada’s Olympians are using data analysis to build a platform to the podium

CALGARY — There is no paralysis in the analysis that Canadian Tire’s data-crunching wizards are doing for sport in this country.
It’s all about moving forward. Sooner. Younger. Faster. More efficiently. And always, toward the podium.
Lap times in swimming, start times in luge, split times in speed skating; the eight members of a sports analytics team created a handful of years ago in Oakville, Ont., punch it all in, going back through decades of medal-winning performances. They spit it back out in user-friendly bits and pieces for coaches, high-performance directors, Own The Podium officials, and athletes being tasked with owning those podiums.
Working in partnership with Own The Podium and national sports organizations, they are forecasting future results, working on probability models, and developing interactive tools so sport bodies can leverage those analytics.
There are two distinct pieces to their mathematical toil; firstly, finding diamonds in the rough, the athletes who should be supported with development resources and funding; and secondly, finding a performance edge for those athletes who are already within reach of the podium.
“In short-track speed skating, we focused on where the individuals have to be on the last lap,” said Mark Merritt, vice-president of credit risk management and customer analytics for Canadian Tire.
“If they’re in second or third, do they have a chance of winning that race? What we found out was, by the second- or third-last lap they have to be in first place, or they have to be in a position to be in first place, or they will not win.
“It’s things like that. Strategy. Development. We’ve done some things on judging bias in some sports. It’s a little bit of everything. It’s been a blast doing this.”
They have worked with nine summer sport bodies and 10 winter sport organizations. Their work on luge has focused on the start, its mechanics and alignment. But the work didn’t start there.
“First challenge was, there are 20 luge tracks around the world, at different altitudes,” Merritt said. “We had to figure out how to standardize those so the times are identical across all of them.”
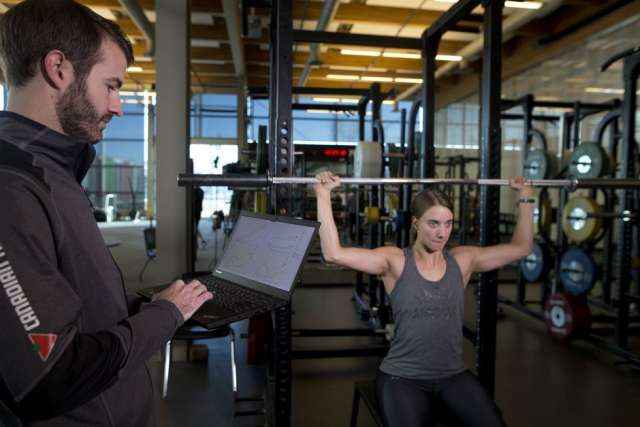
Scott Hunt, left, is one of the sports data analysts helping athletes like luger Kim McRae to focus their training and race-day game plans.
They sliced and diced through the data, according to Justin Detlor, manager of sports analytics for Canadian Tire, to remove variables like ice temperature, air temperature, snow, wind, sun and altitude.
“The whole field can shift because there is heavy frosting or snow falling. Creating some of those advanced stats, the Corsi of luge, it gives them more info to what’s actually happening when you strip out the environmental details.”
And then they zeroed in on the starts.
“So we’re able to use large amounts of data, we’re talking all of the World Cups that have happened in the last 15 years,” Detlor said. “It’s thousands of runs down the track. When you slice and dice that data, it allows us to look track by track and say the importance of the start at this track is worth X amount of what you do down the track.”
At hellacious speed, a hundredth of a second equates to about an inch of linear movement. Athletes routinely miss the podium by a hundredth or two. How does Canada find that inch?
“What we’ve been able to do is ultimately determine what matters in a much quicker way, we take that into the daily training environment and change what we do in terms of athlete preparation to make sure they have a really good race model or plan leading into the start of World Cups,” said Jeremiah Barnert, strength and conditioning coach at Canadian Sport Institute Calgary.
Luge Canada has worked with the data analysts for more than two years, but Luge Canada high-performance director Walter Corey collected race data for 15 years in Excel files. The analysts turned that mountain into a user-friendly treasure trove, accessible, understandable and useful.
“We’re taking the information and making an evaluation and moving forward,” Corey said. “Sometimes the evaluation is status quo. Fact is, you’re using it. These types of tools really just help professionalize and help you make better decisions or ask better questions.
“And we’re just dipping our toe. The thing with analytics, they’re not going away.”
Luge Canada will be focusing more on using analytics to aid talent identification in the next quadrennial. Finding them earlier, faster, younger. Because it isn’t always easy to unearth the diamond in the rough.
“Imagine we have 5,000 swimmers in Canada,” said Merritt. “What 200 of those have the highest probability of generating medals?
“We compare Canadian athletes to the athletes who have been on the podium for generations and say OK, this is where the Canadians are and this is where they need to be to compete at a podium level.”
• Email: dbarnes@postmedia.com | Twitter: @sportsdanbarnes


